Two numbers came out of the same Redfin dataset for Central Fargo this summer, covering the three months ending June 2026, and they should not both be true. The median sale price fell 5.5 percent year over year, landing at $258,000. In the same window, the median price per square foot rose 27.1 percent, to $164. A neighborhood cannot be getting cheaper and more expensive at once. Except it can, and once you understand why, you understand something about how Fargo actually prices its housing stock that the citywide median completely hides.
The number everyone quotes is flatter than it looks
Zoom out to the city level and the story looks calm. Over the three months ending May 2026, Fargo's median sale price sat at $315,000, up a modest 0.7 percent from the same period a year earlier. Price per square foot barely moved either, up just 0.6 percent to $168. Days on market ticked up slightly, from 32 to 36. Nothing here suggests a market doing much of anything interesting.
But a citywide median is an average of very different rooms in the same house. Central Fargo's 27.1 percent jump in price per square foot did not happen in a vacuum, and it did not happen because sellers there suddenly decided to charge more. It happened because the value of an existing square foot of living space in that part of the city climbed sharply, even as the mix of homes selling there shifted toward smaller, more affordable properties, which is exactly what pulls a median sale price down while price per square foot climbs. Ninety-four homes sold in Central Fargo in June 2026, up from 71 a year earlier, and they moved fast, a median of 25 days on market compared with 27 the year before. More homes, faster sales, rising per-square-foot value, and a falling median. That combination only makes sense if you know what has been happening to the housing stock itself.
The city is paying to keep this exact neighborhood competitive
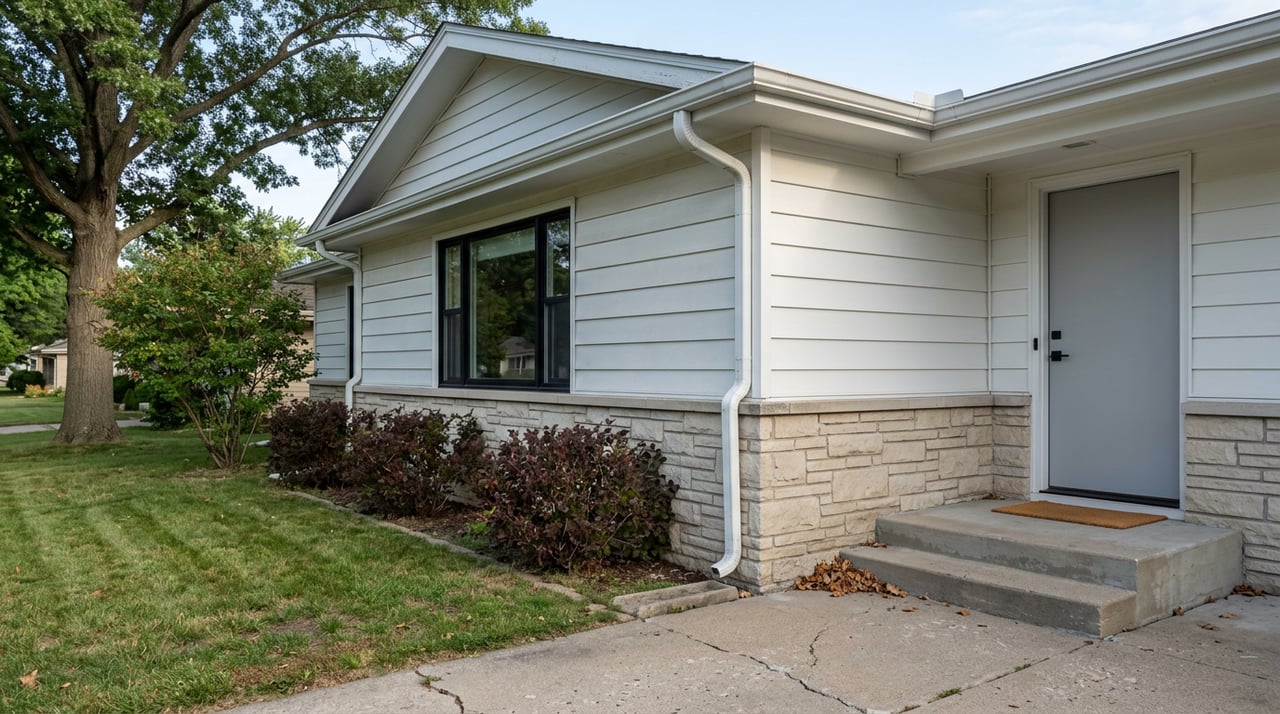
In March 2026, the City of Fargo and Gate City Bank relaunched the Neighborhood Revitalization Initiative for another year, committing $2 million to below-market home improvement loans. The program has run since 2003, and Gate City Bank's own retail banking leadership has said the bank has now put more than $127 million into it across its footprint. The 2026 terms are specific: loans of $10,000 to $100,000, repaid over 10 or 15 years, available only to owner-occupied homes at least 40 years old, assessed under $300,000, sitting inside a defined NRI boundary in the city's older core.
Do the math on "at least 40 years old" against today's date and you get a build year of 1986 or earlier. That description fits a large share of the housing stock in Central Fargo and Downtown Fargo, the exact neighborhoods where the per-square-foot numbers are moving the most.
Fargo's mayor put the logic plainly when the 2026 round was announced. Homes that are 50 or 60 years old need a way to get rejuvenated, and the loans exist so a young couple can take on one of those houses instead of writing it off. That is not a side benefit of the program. That is the program. A below-market loan for a new furnace, a new roof, or a foundation repair does not just fix one house. Enough of them, applied across enough blocks over enough years, changes what buyers are willing to pay per square foot in that part of the city, because the housing stock stops depreciating out of contention.
What this actually buys, block by block
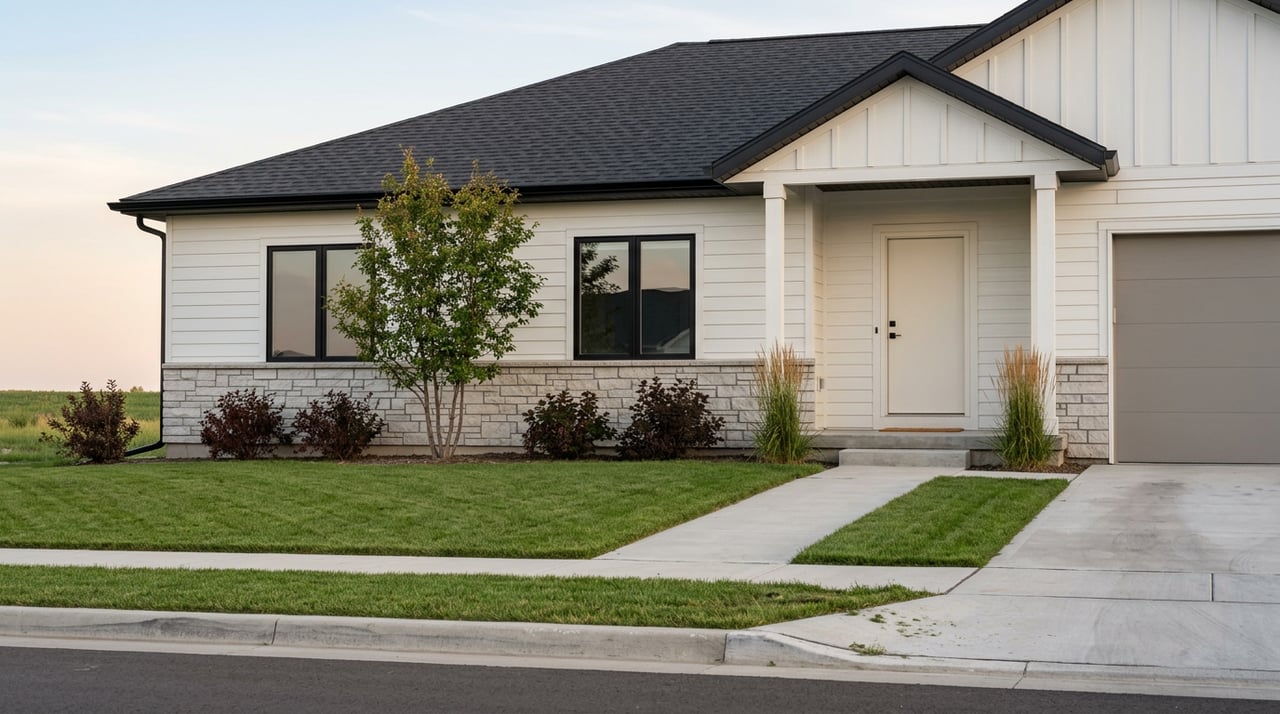
New construction in Fargo is a completely different product, and the recent Selkirk Place and Selkirk Place 2nd Addition listings in south Fargo, along with builds in Madelyn's Meadows, make that clear. These are homes with three-stall garages, quartz islands, and builder incentives like closing-cost credits, priced as new product because they are new product. That segment competes on floor plans and finish packages, not on square-foot appreciation in an established block.
The building permit list the city published on August 15, 2026 captures both markets in a single snapshot. New residential permits that week included a $375,000 build from Echo Homes and a $400,000 build from Dennis Carlson Construction, the kind of dollar figures you would expect from a growing subdivision. In the same list sat a $5,860 window replacement and a $13,053 remodel, the kind of investment that only makes sense on a home someone already owns and intends to keep. Two very different bets on the same city, in the same week, on the same public record.
If you are comparing a renovated bungalow in an established Fargo block against a new build on the edge of town, the honest comparison is not "which one is the better deal." It is "which market are you actually buying into." One is priced against new-construction costs and builder promotions. The other is priced against what a square foot of rehabilitated, already-established housing is worth to buyers who increasingly cannot get that combination anywhere else in the metro, and who are competing for a shrinking supply of it, evidenced by the drop in Central Fargo's average days on market.
Downtown Fargo shows how easily this data lies to you
Before you trust any single neighborhood statistic, look at what happened to Downtown Fargo in the same reporting window. Median sale price fell 70.8 percent year over year, to $177,000. Price per square foot rose 83.6 percent, to $218. Both of those are enormous swings, and neither one reflects what you probably think it does.
Only 10 homes sold in Downtown Fargo in June 2026, compared with 3 the year before. When your entire sample for a neighborhood is single digits, one high-value loft closing or one low-value fixer closing can swing a median by double-digit percentages without anything changing about the underlying market. Days on market fell from 337 to 57 in the same window, which tells you inventory that had been sitting is finally clearing, but it does not tell you prices crashed or spiked. It tells you to treat any hyper-local percentage change with real caution until you know how many transactions are behind it.
What to actually do with this if you're comparing neighborhoods
- Ask for the transaction count behind any neighborhood statistic before you react to the percentage. A 70 percent swing on 10 sales means something very different than the same swing on 300.
- If you are looking at an older home anywhere in Fargo's core, check whether it or a comparable one nearby has used an NRI loan for recent work. It is a strong signal the block is being actively maintained rather than left to depreciate.
- If you are comparing a renovated older home to new construction at a similar price point, compare price per square foot, not sale price alone. The two products are priced against different cost structures and different scarcity.
- Treat any single month of neighborhood-level data as a data point, not a verdict. Look at the trailing three-month window and the year-over-year change together, the way Redfin's own neighborhood reporting does.
A few questions worth answering directly
Which Fargo homes actually qualify for the NRI loan? The 2026 program requires the home to be owner-occupied, at least 40 years old, assessed under $300,000, and located inside the city's defined NRI boundary. New construction, including anything in South Fargo's newer subdivisions, does not qualify because it does not meet the age requirement.
Why did Central Fargo's median sale price fall while price per square foot rose 27 percent? More homes sold, and the mix shifted toward smaller or lower-priced properties, which pulls the median sale price down even while each square foot of space is commanding significantly more than it did a year earlier. Both numbers can be accurate and tell different parts of the same story.
Why did Downtown Fargo's numbers swing so wildly in the same quarter? Volume. Only 10 homes sold there in June 2026. At that sample size, a single unusual sale can move the median by tens of percentage points without reflecting a genuine market shift.
If you are trying to figure out what a Fargo neighborhood's numbers actually mean for your specific search or your specific listing, that is the kind of read I do for a living. I have watched these blocks long enough to know when a headline stat is telling the truth and when it needs a second look.
Tyler Bretz can walk you through what the data means for the specific block or subdivision you're weighing, and get you a clear read on what your own home is worth in today's market. Get a free home valuation and let's talk about which side of Fargo's market you're actually standing in.